First off my ASP/VB.net skills are severely lacking so I am primarily using the GUI tools to generate most of the code for me, although I have managed to dabble a little. However I am struggling to understand how or whether or not it's even possible to represent only the top 5 or 10 or whatever y value labels for a series. For example I have a sqldatasource which pulls 3 series of data to show usage over a period of time as per the below;
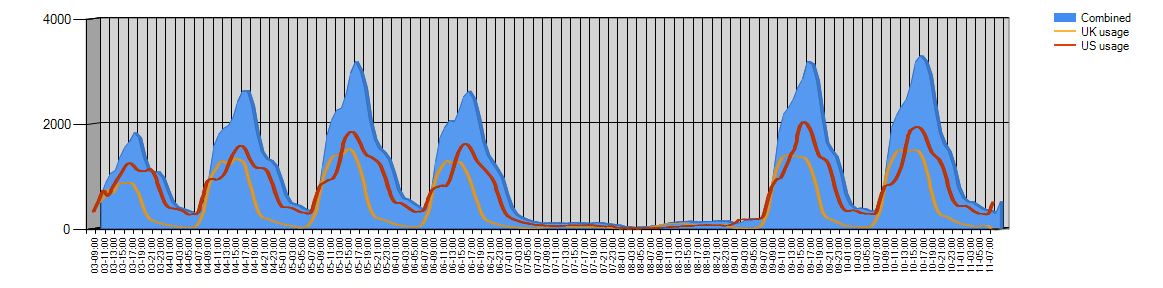
My aim to only show the labels for the TOP 5 max y values for a series (combined). For instance I want ti display a value over each of the peaks. Below is the code which generates the above chart from the sqldatasource. I initially thought this could be achieved via setting a specific data point within the series but I have no idea how to set it to show multiple TOP #MAX points and/or with a label.
<asp:Chart ID="Chart4" runat="server" DataSourceID="SqlDataSource1"
        Width="1200px"><Series><asp:Series ChartType="Area" Name="Combined" XValueMember="Time"
               YValueMembers="All" Legend="Legend2" ToolTip="(#VALX)-#SERIESNAME(#VALY)"></asp:Series><asp:Series ChartType="Spline" Name="UK usage" XValueMember="Time"
                YValueMembers="UK" Legend="Legend2" ToolTip="(#VALX)-#SERIESNAME(#VALY)"></asp:Series><asp:Series ChartType="Spline" Name="US usage" XValueMember="Time"
                YValueMembers="US" Legend="Legend2" ToolTip="(#VALX)-#SERIESNAME(#VALY)"></asp:Series></Series><ChartAreas><asp:ChartArea Name="ChartArea4"><AxisX Interval="2" IsLabelAutoFit="True"
                        LabelAutoFitStyle="LabelsAngleStep45"><LabelStyle Angle="40" Font="Microsoft Sans Serif, 7pt" /></AxisX><Area3DStyle Enable3D="True" Inclination="10" WallWidth="1" LightStyle="Realistic" /></asp:ChartArea></ChartAreas><Legends><asp:Legend Name="Legend2"></asp:Legend></Legends></asp:Chart>
Any help or pointers would be greatly appreciated.
I am currently using Web Developer 2010 (I know a little outdated!).
TIA, Paul.